You can get an idea of how much your household energy use from each source is contributing to total greenhouse gas emissions and air pollution by completing the following form.
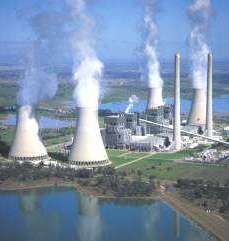
Electricity production is responsible for 37% of total greenhouse gas emissions
in Australia (171.8 megatonnes out of 458.2 megatonnes in 1999). Most (85%) of the
electricity is produced from coal.
Black coal plants in NSW average about 850 tonnes of carbon dioxide per gigaWatt-hour.
The other principal pollutants from power stations are sulphur dioxide, nitrogen oxides,
and particles (PM10).
The following table lists the main air pollution emissions for Bayswater power station,
one of the largest in NSW, for the year 2000-2001. Over that year the power station
transmitted 15,246 gigawatt-hours of electricity, and produced 14.2 megatonnes of CO2,
or 931.6 kilograms of CO2 per megawatt-hour.
| kilograms |
|
|
| Arsenic & compounds | 30 | |
| Cadmium & compounds | 13 | |
| Carbon monoxide | 1700000 | |
| Chromium (VI) compounds | 19 | |
| Cobalt & compounds | 34 | |
| Fluoride compounds | 670000 | |
| Lead & compounds | 95 | |
| Mercury & compounds | 300 | |
| Oxides of Nitrogen | 33000000 | |
| Particulate Matter 10um | 1800000 | |
| Polycyclic aromatic hydrocarbons | 21 | |
| Sulfur dioxide | 74000000 |
The emission factors used in the calculator are based on data from the Australian Greenhouse Inventory 1999, and the National Pollutant Inventory.
 Car travel caused 42.1 megatonnes, or just over 9%, of greenhouse gas emissions
in Australia in 1999. This was 57% of the total contribution from all domestic transport.
Petrol fuelled cars are the main source of carbon monoxide and nitrogen oxides
emissions in urban areas.
They are also a significant source of volatile organic compounds (VOCs)
from the evaporation and incomplete combustion of fuel. Catalytic converters,
in car models post 1985,
reduce the amount of CO, NOx, and VOC in exhaust emissions, but have increased
nitrous oxide (N2O).
Diesel fuelled cars have lower CO and VOC emissions, but PM10 particle emissions
are much greater than from petrol vehicles. PM10 from diesel
vehicles (including trucks) contribute up to 80% of all vehicle PM10 emissions.
Car travel caused 42.1 megatonnes, or just over 9%, of greenhouse gas emissions
in Australia in 1999. This was 57% of the total contribution from all domestic transport.
Petrol fuelled cars are the main source of carbon monoxide and nitrogen oxides
emissions in urban areas.
They are also a significant source of volatile organic compounds (VOCs)
from the evaporation and incomplete combustion of fuel. Catalytic converters,
in car models post 1985,
reduce the amount of CO, NOx, and VOC in exhaust emissions, but have increased
nitrous oxide (N2O).
Diesel fuelled cars have lower CO and VOC emissions, but PM10 particle emissions
are much greater than from petrol vehicles. PM10 from diesel
vehicles (including trucks) contribute up to 80% of all vehicle PM10 emissions.
In general, the more kilometres a car has
accumulated, the greater are the emissions. Also regular tuning and maintenance will help
to minimise emissions. Visible smoke and sooty deposits around the exhaust
are indicators that the engine requires a check-up.
The type of travel and
how the car is driven are also important factors; e.g.
short trips
produce more CO and VOC's per kilometre.
What you can do to reduce pollution.
National Fuel Quality Standards
|
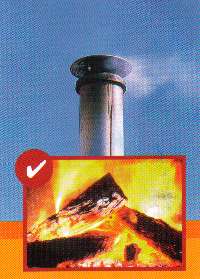
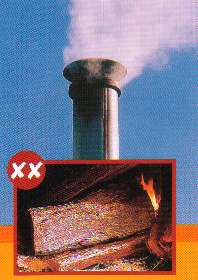
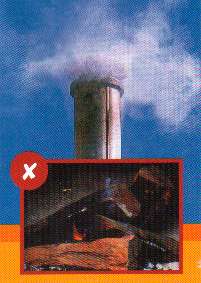
According to Environment
Australia, smoke from woodheaters and fireplaces is a
major source of air pollution.
Woodsmoke has an impact on air quality both at the local level in residential
neighbourhoods, and at a regional level - smoke from woodheaters is estimated to
account for 50% of airborne particles in Sydney on a winter's weekend. Emissions from woodheaters depend greatly on how well the heater is operated. The following is a rough guide, based on Environment Australia's 'Check Your Chimney' information sheet:
|
|
|
|
|
|
Although only relatively small amounts of fuel are used by householders for lawn mowing, the emissions produced can be significant at the local level. A study in 1996 found that lawn-mowing in Australian capital cities was responsible for an estimated 108,000 tonnes of carbon monoxide, 34,000 tonnes of hydrocarbons (excluding methane) and 450 tonnes of nitrogen oxides each year. Another study in the U.S. in 1997 estimated that a conventional lawn-mower can produce as much pollution in an hour as 40 late model cars. This can result in significant local air pollution, especially on weekends, in sheltered suburbs, and on less windy days. The pollution is also concentrated at ground level, so people in the immediate vicinity may inhale relatively large amounts of the pollutants. Lawn-mowers with 2-stroke engines using a petrol/oil fuel have much worse emissions than 4-stroke lawn-mowers, particularly for particles and VOCs. Clean Air Lawn Care.
|
|
|

|
Home | Introduction |
News | Resources Solar Heating | Energy Efficiency | Renewable Energy | Solar Retrofit |
|
|
|
|
Page created on Saturday, 9 February 2002. |
|