Energy Efficiency

Home | Introduction | News | Resources
Energy Efficiency |
|
Home | Introduction | News | Resources | |
New homes, however, represent only a small proportion of our housing stock, so there is an even greater need to retrofit existing homes to improve their efficiency. It is estimated that only 20% of all residential buildings in Australia have both wall and ceiling insulation. A further 42% have ceiling insulation only. The remaining 38% have neither (AGO 1999). Even in Armidale with its colder winters, the Armidale City Planner reported that 47% of new houses built in Armidale in 1992 had no roof insulation and 67% no wall insulation, apart from reflective foil. Less than 10% had adequate north-facing glass and thermal mass.
Go to 'Benefits of Energy Efficiency'
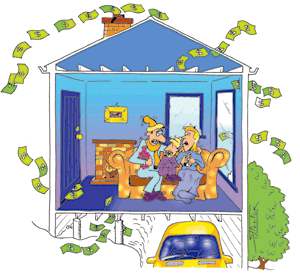 |
Where heat leaks
out
42% through the ceiling 24% through the walls 12% through unblocked chimneys and draughts around doors and windows 12% through windows 10% through the floor |
Heat loss through windows can be reduced by sealing gaps, and using curtains, window quilts, or insulating window shutters to keep heat in at night. However as the house becomes more airtight, greater attention has to be paid to indoor air quality. One possibilty to to use solar air collectors to pre-heat ventilation air, and supplement the existing space heating system.
![]() Residential Energy Use
Residential Energy Use
Total residential energy use in Australia in
1999 was estimated to be 377 petajoules (PJ) (units). The main
source of energy was electricity (43%), followed by gas (31%), then wood
(21%). Petroleum, mainly LPG, accounted for 5% (AGO 1999,
2001).
Electricity was used mainly for applicances (59%) and water heating (28%); 5% of electricity consumption was for cooking and 5% for space heating/cooling. The fridge accounted for the highest electricity consumption of electric applicances (14.5% of total electricity consumption), followed by lighting (10%). It is interesting to note that standby power, that is small amounts of power drawn by many modern appliances for electronic controls even when the appliance is not being used, was estimated to be 6% of total electricity consumption.
Gas was predominantly used for space heating (60%) and water heating (35%), with 5% for cooking. Space heating and cooling was responsible for 43% of total residential energy use, with nearly 49% of the energy provided by wood burning, and 43% by gas.
![]() The
Sustainable Energy Development Authority (S.E.D.A.) has a 12 step guide to
making your home energy efficient and greenhouse friendly. For example, they
estimate that installing ceiling insulation can save you more than $4,000 and 40
tonnes of greenhouse gas over the lifetime of your home. A solar water heater
can save 65% of the energy required to heat your hot water, and can qualify for
a $500 discount.
The
Sustainable Energy Development Authority (S.E.D.A.) has a 12 step guide to
making your home energy efficient and greenhouse friendly. For example, they
estimate that installing ceiling insulation can save you more than $4,000 and 40
tonnes of greenhouse gas over the lifetime of your home. A solar water heater
can save 65% of the energy required to heat your hot water, and can qualify for
a $500 discount.
![]() Discovering more about energy, where is comes from, how much it costs
financially and environmentally, and how we use it, can be interesting school
projects - for example, Watt
Watchers, and Kids
Crusade For Less Energy, featured on Channel 9's ACA, 29 Nov 2001.
Discovering more about energy, where is comes from, how much it costs
financially and environmentally, and how we use it, can be interesting school
projects - for example, Watt
Watchers, and Kids
Crusade For Less Energy, featured on Channel 9's ACA, 29 Nov 2001.
![]() Green and Clever - Your Home in
the 21st Century
Green and Clever - Your Home in
the 21st Century
- demonstrates how the latest environmental solutions are
being applied to conventional housing, leading to "huge savings for home owners
and the environment".
![]() Two
community based projects to provide assistance for retrofitting local housing
(in New Zealand, any similar here?):-
Two
community based projects to provide assistance for retrofitting local housing
(in New Zealand, any similar here?):-
Opotiki
home energy improvement scheme
Community
Energy Action provides access to household energy efficiency measures for
people on low incomes.
(I think these links are no longer valid.)
![]() Greenhouse Gas Emissions
Greenhouse Gas Emissions
Carbon Dioxide (CO2) is the
principal greenhouse gas associated with global warming, see Turning Down The Heat. Also
important are methane (CH4), with a global warming potential of 21
relative to CO2, and nitrous oxide (N2O) which has a
global warming potential of 310.
Australia has the highest per capita emissions of greenhouse gas among industialised nations (Australia Institute, 2001). According to the Australian Greenhouse Office inventory, Australia produced 458.2 million tonnes net of greenhouse gas in 1999 (latest available figures).
At the household level, Australia's seven million homes are responsible for the production of more than 50 million tonnes of greenhouse gases every year - almost 12% of the total net greenhouse emissions in 1999 - (not considering private motor vehicle use, which amounts to another 42 million tonnes).
The biggest contribution comes from electricity consumption, nearly 46 million tonnes in 1999, or nearly 84% of the total from residential energy use. Roughly 1 kilogram of greenhouse gas is emitted for every 3.5 MJ of energy consumed - thats the amount of energy used by a 1 KW electric radiator in just under 1 hour. (The notable exception is Tasmania where most electricity is generated using hydro power.)
Gas use in the home was responsible for just under 11% of the total greenhouse gas emissions from residential energy use.
Greenhouse gas emissions from wood heating are usually treated differently to greenhouse gas emissions from fossil fuels. Burning wood emits about as much CO2 as burning coal per unit of energy produced - about 89 kg/GJ, and 70% more than natural gas - 52kg/GJ (units). However, biomass is part of the carbon cycle, and growing biomass absorbs CO2 from the atmosphere. Therefore, CO2 emissions from biomass need to be considered within the overall context of biomass change. In the Australian National Greenhouse Gas Inventory, only the non-CO2 greenhouse gases are reported in the the net greenhouse contribution from biomass burning. The CO2 emissions are accounted for in the 'change in biomass' component of the inventory. In the table below, under greenhouse gas emissions from domestic woodheating, 'Actual' refers to the total estimated emissions (including CO2), and 'Net' refers to only the non-CO2 component. There is considerable variation in the estimates of the emissions of non-CO2 greenhouse gases, especially methane (Edgerton, 1986). Methane emissions depend on the type of heater, ie open fireplace or woodstove, and the method of burning; a low burn-rate with low levels of oxygen produces greater emissions of methane. According to the National Greenhouse Inventory (1999) methane accounts for 94% of non-CO2 greenhouse gas emissions from woodheating, the rest is nitrous oxide. Carbon monoxide (CO) emissions are not included in the total, although it has an important indirect effect on greenhouse gas formation, its global warming potential is not yet fully quantified (IPCC, 2001).
| Electricity | Gas | Petroleum | Wood | |||||
|---|---|---|---|---|---|---|---|---|
| Energy Use PetaJoules | 161.0 | 116.1 | 19.3 | 81.3 | ||||
| Emissions MegaTonnes CO2 equivalent |
45.7 | 5.9 | 1.2 |
|
Further information on greenhouse gases, the effect on global warming, and some steps to reduce greenhouse gas emissions, can be read in Global Warming - Cool It!
![]() Air
Pollution
Air
Pollution
Particulates (PM10), and especially fine particles
(PM2.5) are now recognised as the major cause of adverse health effects from air
pollution (Schwartz
1996). Particulates are created in fuel combustion processes, including
driving motor vehicles (diesel fueled vehicles are the worst contributors) and
electricity production. Over the greater Sydney region, including Newcastle and
Wollongong, electricity generation is responsible for 15% of total annual PM10
emissions (see
table). Natural gas produces very little particulate emissions.
One of the largest sources of fine particles from individual use is burning wood in fireplaces and woodheaters. Particulate emissions from wood burning depend on the type of heater, ie open fireplace or woodstove, and the method of burning; a low burn-rate produces greater emissions.
Although less than 20% of households use woodheating as their main source of heating, smoke from domestic wood burning is estimated to account for 35% up to 50% of total suspended particles in Sydney air in winter (State of the Environment Report 2000). A significant factor is that woodheater emissions are concentrated in residential areas. Recent research (Morgan 1998) has linked fine particle concentrations with an increase in daily mortality of 400 deaths per year in Sydney. Long term effects are probably several times greater (Brunekreef 1997).
Other important air pollution emissions relating to energy production and use include:
| Electricity Production | Domestic Solid Fuel Burning | All Sources | |
|---|---|---|---|
|
| |||
| PM10 | 2,700 | 3,100 | 18,000 |
| Carbon Monoxide | 2,800 | 31,000 | 1,000,000 |
| Oxides of Nitrogen | 51,000 | 390 | 180,000 |
| Sulphur Dioxide | 67,000 | 72 | 97,000 |
| Total Volatile Organic Compounds | 4 | 12,000 | 150,000 |
| Polycyclic Aromatic Hydrocarbons | - | 72 | 120 |
| Benzene | - | 290 | 3,900 |
| Methane | Nitrous Oxides | Oxides of Nitrogen | Carbon Monoxide | Non-methane Volatile Organic Compounds | Sulphur Dioxide | |
|---|---|---|---|---|---|---|
|
| ||||||
| Electricity Generation1 | 1,008 | 492 | 125,718 | 12,071 | 2,284 | 116,836 |
| Petroleum 2 | 1,950 | 10 | 1,100 | 64,600 | 17,130 | - |
| Gas | 190 | 10 | 4,500 | 1,900 | 360 | - |
| Wood | 81,190 | 330 | 6,800 | 597,700 | 192,520 | - |
Calculate your household energy use greenhouse gas and air pollution profile.
|
Home | Introduction
| News |
Resources
Solar Heating | Energy Efficiency | Renewable Energy | Solar Retrofit |
| Page created on Thursday, 9 August
2001. Created by Solar Armidale Project. | |